
The one-page brand ops dashboard: what to track weekly across 5+ niches
If you manage multiple niche brands, your weekly chaos needs a single dashboard. Track the right weekly metrics and keep your workflow tight.
Elena is sitting at her kitchen table with cold coffee and three tabs open: one for ads, one for email, one for a spreadsheet she started six weeks ago and never finished. Her phone buzzes with a Slack message from her "future self" reminder: Check Brand 3. She sighs, because she genuinely cannot remember what "check Brand 3" even means.
That's the moment a one-page brand ops dashboard earns its keep. Not a fancy tool. A weekly ritual with the same set of numbers across every niche, so you stop re-learning your own business every Monday morning.
If you're running multi niche management for 5+ brands, you don't need more dashboards. You need one founder dashboard that tells you what moved, what broke, and what to do next.
Here's a practical setup you can copy.
What the brand ops dashboard is (and what it is not)
A brand ops dashboard is a single page you can scan in under 10 minutes. Same sections every week, even when your niches change, your channels change, and your brain is running on fumes.
It's for weekly metrics, not "someday" analysis. You're not building a data warehouse. You're trying to answer four questions fast: What did I ship? What improved? What fell apart? What will I do next?
It's also not a scorecard that makes you feel bad. You're not grading yourself. You're tracking signals so you can put your time where it actually matters.
Here's the trap I fell into early: I used to track a giant list of metrics. Every week I'd stare at it and think, "Cool, nothing is working, and I should probably rewrite everything." Then I realized I was chasing vanity numbers and ignoring workflow tracking. The dashboard didn't need more metrics. It needed a clearer link between actions and outcomes.
With Zentoko's adaptive learning system, your weekly workflow tracking can stay consistent across niches because the system helps you keep the same "measure, learn, adjust" loop even when the brand themes differ.
The one-page layout: 5 sections you can reuse across niches
Your one-page brand ops dashboard should have five blocks. Each one answers a weekly question.
1) Ship log (what you did)
Smallest block. The one you'll thank yourself for later.
Track only what you shipped or changed that week. Not everything you touched, not "I brainstormed." Actual outputs.
Use a simple format:
- Content shipped: 3 posts, 1 reel, 2 email sends
- Offer shipped/updated: new landing page hero, revised pricing section
- Ops shipped: updated onboarding email, fixed checkout friction
If you manage 5+ niches, you will forget what you did. The ship log prevents that. It also makes it obvious when you're waiting for results from actions you never actually took.
Practical takeaway: If your ship log is empty, your dashboard becomes a guessing game. Make "ship log entries" part of your weekly metrics.
2) Outcome metrics (what moved)
This is where you track weekly metrics that connect to revenue, even if the connection is indirect.
Pick 2-4 outcome metrics per niche. Keep them consistent week to week.
Common options that work across many niches:
- Leads or inquiries (email signups, contact forms, DM leads)
- Conversion rate on your main page (landing page to email capture)
- Email engagement that predicts revenue (reply rate, click rate, or list growth)
- Sales or revenue (if you have enough volume to trust it)
With 5+ niches, you might not have sales data for all of them every week. That's normal. Use the closest upstream signal you can trust.
Practical takeaway: Your dashboard should be comparable week to week within a niche, not comparable across niches. "Brand A did 2x Brand B" is less useful than "Brand A improved week over week."
3) Workflow tracking (where you're stuck)
This is the block most people skip. They track outcomes only, then wonder why they can't repeat a win.
Workflow tracking means you measure the friction in your system. Pick 1-2 signals per niche. Examples:
- Time to publish (idea to post)
- Time to respond (lead to first reply)
- Content production bottleneck (rewriting, approvals, editing)
- Bounce points (emails that never get sent, tasks that keep slipping)
If you have no idea what to track, start with one question: "What did I delay and why?" Then translate the answer into a simple weekly field.
Practical takeaway: If you only track outcomes, you'll keep rewriting your brand strategy when the real problem is your workflow.
4) Risk and quality (what might break)
Your early warning system. You're scanning for things that quietly kill momentum.
Track these as yes/no or simple status:
- Tracking is working (UTMs, analytics events, email deliverability)
- Offer page still matches the current pitch (no stale copy)
- Key links work (checkout, scheduling, forms)
- Audience quality is holding (spam rate, low-quality signups)
You don't need 20 checks. You need the few that actually cause problems.
Practical takeaway: Most "growth plateaus" are actually broken tracking, stale pages, or a lead response lag. This block catches that.
5) Weekly decisions (what you do next)
This is where your one-page dashboard becomes a workflow, not a report.
For each niche, write:
- One thing to scale (if a metric improved)
- One thing to fix (if a metric dropped)
- One experiment to run (small, time-boxed)
Keep it small. You're not building a thesis, you're making decisions.
Practical takeaway: If you can't write the next action in one sentence, the dashboard is too vague.
How to track weekly metrics across 5+ niches without losing your mind
With 5+ niches, you can't review everything equally every week. You need a cadence, and your dashboard should support a "rotate and focus" rhythm.
The 3-tier review
Split each niche into a tier based on where it sits in the cycle.
- Tier 1: Active push (you're shipping consistently)
- Tier 2: Stabilize (you shipped, now you're learning)
- Tier 3: Low-touch (maintenance until you have capacity)
Then review each tier differently.
For Tier 1, you review all five dashboard blocks.
For Tier 2, you review outcomes plus workflow tracking plus risks.
For Tier 3, you review only outcome metrics and risk, and you keep the ship log light.
Practical takeaway: Multi niche management is a capacity problem, not a motivation problem. Your dashboard should reflect that.
The one-page rule
A real founder dashboard stays readable. If your page quietly becomes a spreadsheet in disguise, you'll stop using it, and then you're back to cold coffee and three tabs.
Use this rule: if you can't explain the dashboard to someone in 30 seconds, it's too complicated. Keep the same structure across niches. Your brain loves patterns.
Weekly metrics should be "enough," not "perfect"
People ask, "Which metrics should I track weekly?" as if there's one correct answer.
The truth is messier. You track the metrics that are stable enough to show movement and close enough to your actions that you can actually learn from them.
A good set of weekly metrics has these traits:
- It changes within weeks, not months
- It connects to an action you can take
- It is measurable without heroics
If you're stuck, start with leads or inquiries, conversion rate on your main page, and email engagement (reply rate or click rate). Then add one workflow tracking signal.
Practical takeaway: You can't optimize what you don't measure, but you also can't measure your way out of shipping. Keep the set small.
The workflow tracking loop: how to turn dashboard numbers into action
You have the page. Now you need the loop.
The loop is what keeps weekly metrics from becoming weekly stress. Here's the one I use when I'm managing multiple niche brands and I'm tempted to burn everything down and start over.
Step 1: Look at the ship log
Ask: did I ship anything that could create movement?
If the ship log is thin, your outcomes aren't "bad." They're waiting. This is where founders lie to themselves. They think they're behind because results are missing, when sometimes they're behind because the work didn't go out.
Practical takeaway: The ship log is a reality check.
Step 2: Match outcomes to actions
Now ask: did the outcome metric move in the direction you'd expect from the ship log?
If you shipped content and leads rose, that's a signal. If you shipped a landing page update and conversion dropped, that's also a signal. Maybe the update confused people. Maybe the offer mismatch got worse.
Practical takeaway: You're not hunting for meaning. You're hunting for correlation.
Step 3: Inspect workflow tracking
If outcomes moved the wrong way, check friction first.
- Did lead response time slow down?
- Did you publish later than planned?
- Did you stop updating emails?
Workflow tracking gives you a concrete "why," not a gut feeling.
Practical takeaway: Fixing a workflow problem is faster than rewriting strategy.
Step 4: Pick one experiment
Your dashboard ends with a decision. One experiment, time-boxed, next week.
Examples that fit most niches:
- Change one headline and keep everything else the same
- Send one new email to the same segment with a different angle
- Post one piece of proof content and measure reply rate
Not five experiments. One.
Practical takeaway: One experiment keeps your learning clean.
Step 5: Update the dashboard for next week
The part people skip. You update your next-week assumptions based on what you saw.
If a metric improved, write what you're scaling. If a metric dropped, write what you're fixing. If the numbers didn't move, write what you're changing about the workflow.
Practical takeaway: Your one-page brand ops dashboard becomes a memory system.
With Zentoko's adaptive learning system, you can keep the "measure, learn, adjust" loop consistent across niches so your weekly decisions are based on pattern, not vibes.
A sample dashboard you can copy (weekly across niches)
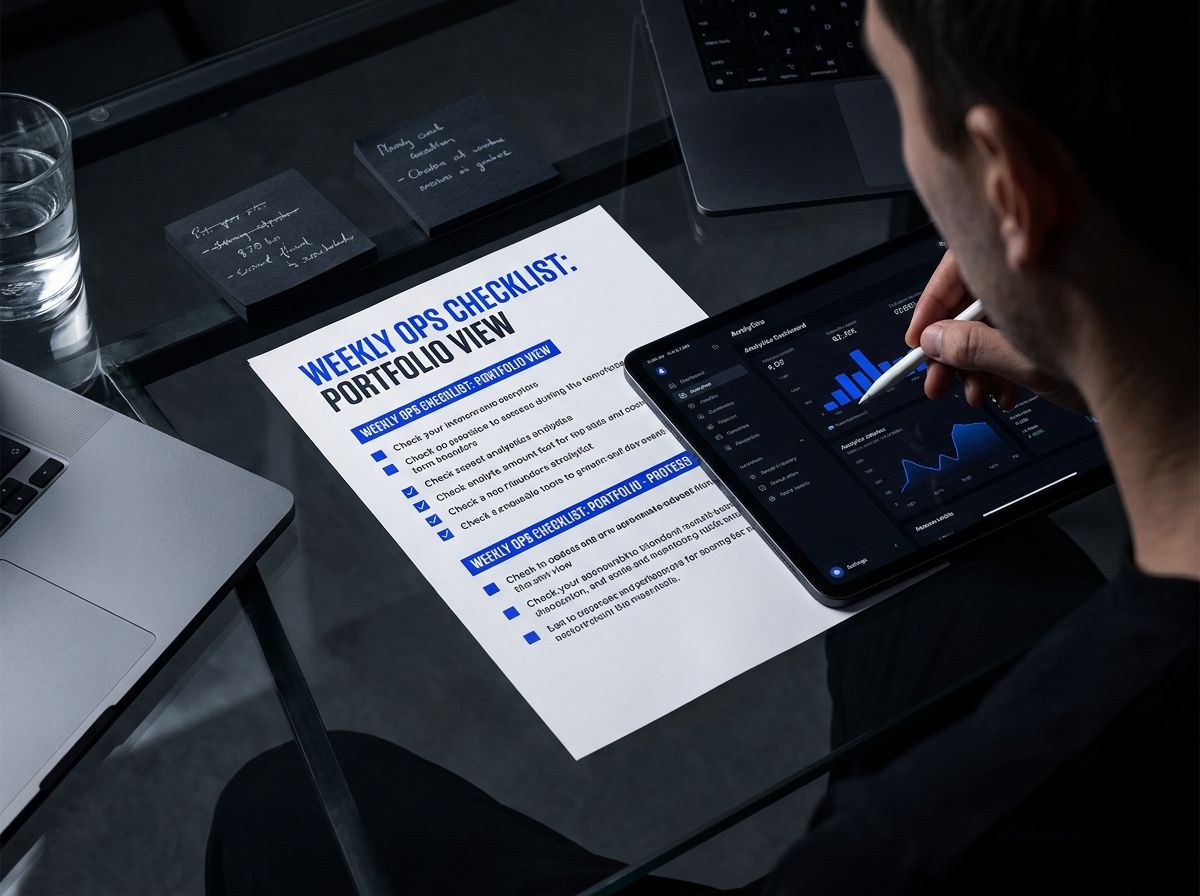
Below is a template. Build it in Notion, Google Sheets, a doc, or a printed page on your desk. Make one page per niche, then roll up a "portfolio view" on top.
Portfolio view (first glance)
Track totals across your niches at the top of the page. Keep it minimal:
- Total leads this week
- Total sales/revenue this week (if applicable)
- Total email sends this week
- Top 1 risk across all niches
Then each niche gets its own mini-block below.
Niche mini-block (repeat for each brand)
Ship log:
- Content shipped:
- Offer shipped/updated:
- Ops shipped:
Outcome metrics:
- Leads/inquiries:
- Conversion rate:
- Email engagement:
Workflow tracking:
- Time to publish:
- Lead response time:
Risk and quality:
- Tracking working? (Y/N)
- Offer page current? (Y/N)
- Key links working? (Y/N)
Weekly decisions:
- Scale:
- Fix:
- Experiment:
Practical takeaway: This format keeps your weekly metrics review fast. You will actually do it.
Common failure modes (so you can avoid them)
If you've tried dashboards before, you've probably hit at least one of these.
Failure mode 1: Tracking too many metrics
When you track 25 numbers, you stop trusting all of them.
Pick 2-4 outcome metrics and 1-2 workflow signals. That's the ceiling.
Failure mode 2: No link between actions and numbers
If your ship log is vague, your dashboard becomes a blame game. Write outputs you can point to.
Failure mode 3: Reviewing too often
Weekly is enough. Daily checking turns into panic. Weekly checking turns into learning.
Failure mode 4: No decisions written down
A dashboard without a "weekly decisions" block is just reading. End with scale, fix, experiment.
Practical takeaway: Your dashboard should end with motion.
How to make this work for your exact situation
You might be solo. You might have a VA or an editor. Either way, the dashboard should match how your work actually happens.
If you have help, use the ship log to assign ownership: who shipped what, who owns workflow tracking signals, who runs risk checks.
If you're solo, use the dashboard to protect your focus. Your next action should be obvious after the review.
And yes, you will still feel behind sometimes. That's normal. You're building multiple brands, your brain wants certainty, and your business gives you data instead. But a one-page brand ops dashboard gives you a weekly rhythm you can actually trust.
FAQ
How many metrics should I track weekly for each niche?
Track 2-4 outcome metrics and 1-2 workflow tracking signals per niche. If you go beyond that, you lose the ability to connect actions to results. Keep the set stable so you can compare week to week.
What if one of my niches has low traffic and no sales?
Use upstream signals you can measure reliably, like leads/inquiries, email engagement, or landing page conversion. The goal is to track movement, not to wait for perfect revenue data. Once volume increases, you can add sales metrics.
Should my founder dashboard look the same for every niche?
Yes, the structure should stay the same. The numbers can differ, but the sections should match so your review takes the same amount of time every week. This is one of the easiest wins for multi niche management.
How do I keep the dashboard from turning into busywork?
Write decisions at the end of the page: one thing to scale, one thing to fix, one experiment. If you can't write those decisions, you're tracking the wrong things or your ship log is too vague. Weekly metrics only matter when they trigger action.
Your next step
Pick one Monday. Build your one-page brand ops dashboard using the five blocks above. Review just one niche at first, write the weekly decisions in plain sentences, then copy the structure to the rest.
You're not behind. You're just missing a single page that tells you what to do next.
Join the conversation
Subscribe to comment
Join the Ziggyloo family newsletter to leave a comment — and get gentle learning tips and community stories in your inbox. No spam, unsubscribe anytime.